
Xplan Quick Xplain
To table_it() or not to table_it() that is the article
about table_it()
Let’s look at another approach to building out tables in templates.
Tables are an inescapable part of finance and financial planning documents, and as such, a common and heavily customised area of xplan templates. Depending on the data, the format, the order and many other factors, creating them can occupy the entire gamut; from basic to incredibly complex and detailed.
Table_it() has some benefits around reducing coding, handling dynamic data and allowing individual businesses on hosted sites to get the format and output of their preference/brand. So lets jump in and see how it works, the benefits and some limitations to keep in mind.
The quest for inbuilt automated tables
Whilst we have the traditional method of building the actual table structure and format into the template itself (then looping over it), through the years IRESS has offered a variety of alternatives designed to automate parts of and make this aspect of templates easier to work with and implement.
All these methods revolve around using a specified table format to dicate the output style:
You can manage and create these via Xplan > Administration > Templates > Merge Templates > Table Format [click here to see a screenshot]
Basic group table
Just about every group has a basic table function in it we could use (seen here). Despite its simple nature, this approach is limited in the ability to customise the data, titles, labels, axis and format needed. This methodology is also not able to be used or applied to everything.
Portfolio Reports
The portfolio reports mechanism allows us to use in default system reports or create our own (with limits) via the portfolio report builder. Again, high ease of use but limited in the areas of data customisation and requested formatting. This system also has the smart ips component to it for doing more with IPS charts, graphs and legends.
Tool specific (supersolver)
The developers working on this seem to love automated tables, I lost count at the different mechanisms and different styles that are available for the same thing in supersolver. Arguably though the module has the most advanced coding for accounting for automated tables – albeit at the question of whether its easier to build and support using this format as the trade off to this is a lot of options to define and add in;
table_it()
This isn’t new functionality, it’s been in Xplan since at least, circa 2012, as seen via 0079519 OSC (another example and point to keeping up to date on the OSC) due to its ubiquity of data inputs and flexibility, this is increasingly becoming popular in a world of highly populated licensee sites and hosted solutions.
table_it(): Overview of how it works
The function itself takes 2 arguments and is straightforward, however, it’s probably best understood as the following process.
1. Define all the labels and loop through the data you want to include in your table, storing both in a series of list variables that can be thought of as rows in a table. The variables themselves are usually called ‘row1’, ‘row2’, row3’ and so forth.
2. For ease its best to bundle all the ‘rows’ you want to include in your table, into a single list variable to encapsulate or contain them all. Often this is named ‘data’ or ‘tabledata’ et al and will look something like this <:let tabledata=[row1, row2, row3]:> or <:=tabledata.extend([row1, row2, row3]):>. The order you set these in is the position they will merge out in.
3. Put it all together, define the two arguments for the function
1) name of the encapsulation or container variable; and
2) the specific table format you want to apply – ensure the table format is in
<:=table_it(list of all data to turn into a table, ‘table format to apply’):>
<:=table_it(tabledata, ‘WC Blue Steel V2’):>
- This is the containing data we discussed in step 2. This list variable just specifies all the ‘rows’ we want to include in the table. We can also define them directly into the function eg, <:=table_it([row1, row2, row3], ‘WC Blue Steel V2’):> however it can often be cleaner and beneficial to add them into the containing variable (tabledata) instead.
- The table format you want to apply. In the example above we’ve specified “WC Blue Steel V2” which is a standard table format available on a lot of sites. Remember the ” around the table format name.
If you are unfamiliar with lists or want to know what some of the functions below are doing, now would be a good time to checkout our lists article.
table_it(): Practical examples
Let’s start by using some basic client focus data and a common sort of table you might come across:
<:let row0=[str(‘’)]:>

<:let row1=[‘Given Name’]:>

<:let row2=[‘Family Name’]:>

<:let row3=[‘Date of Birth’]:>

<:let row4=[‘Marital Status’]:>

<:let row5=[‘Occupation’]:>

<:let row6=[‘Health’]:>

<:let row7=[‘Smoker’]:>

<:let row8=[‘Will’]:>

<:let row9=[‘Power of Attorney’]:>

<:let row10=[‘’] #empty footer row purely to account for the table style being used:>
<:for entity in [$client, $partner] if $client.is_individual and $partner else [$client]:>

<:=row0.append(entity.preferred_name):>
 <:=row1.append(entity.first_name)):>

<:=row2.append(entity.last_name):>

<:=row3.append(str(entity.dob)+’ (‘+str(entity.age)+’)’):>

<:=row4.append(str(entity.marital_status.text)):>

<:=row5.append(entity.iqm2_occupation if entity.iqm2_occupation else str(‘Not disclosed’)):>

<:=row6.append(str(entity.health) if entity.health else str(‘Not disclosed’)):>

<:=row7.append(str(entity.is_smoker) if str(entity.valueOf(‘is_smoker’)) in [‘0’,’1’] else str(‘Not disclosed’)):>

<:=row8.append(str(entity.will_exists.text) if str(entity.valueOf(‘will_exists’)) in [‘0’,’1’] else str(‘Not disclosed’)):>

<:=row9.append(str(‘Yes’) if len(entity.attorney) else str(‘No’)):>

<:=row10.append(‘’):>

<:end:>
<:let tabledata=[row0,row1, row2, row3, row4, row5, row6, row7, row8, row9,row10]:>
<:=table_it(tabledata, ‘WC Blue Steel V2’):>
- In the first part we defined all the list variables (rows) and their labels, that will appear in the first column or the first cell of each row.
- We use ” or empty string (str”)) to ensure that data is registered in that space of the list, otherwise client preferred name would appear in the first cell from our simple append.
- We then looped through the $client and/or $partner entities, appending (adding) the relevant data to each row list.
- tabledata acts as a container to define all the rows (and the order)
- table_it() is used to bring it all together in the specified format (see below)
Outputs
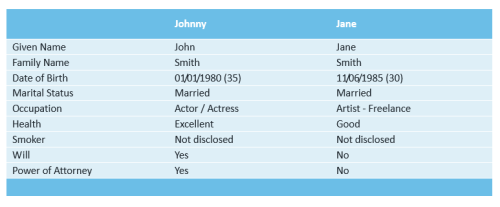
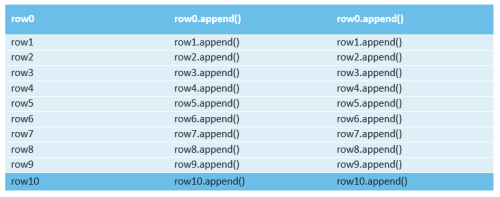
To help relate it back to the coding, the image below maps every item and where the data is essentially being generated from:
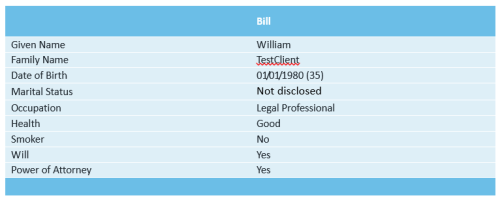
So just from this basic example you can see how the output scales to the number of objects found in the defined data. This allows the one bit of coding to be used to automatically account for different outcomes that traditionally require two sets of tables or codes. In the example above we see it catering to when there is client and partner or just client.
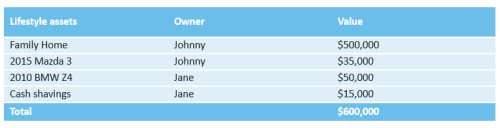
Horizontal tables
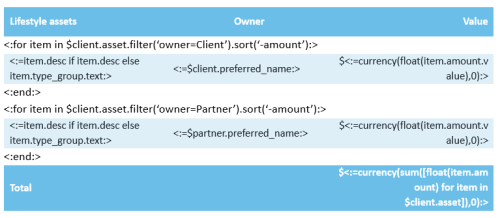
Here is a slightly more of a complex example, showing how you can use this approach to create specifically horizontal table styles:
<:let header=[‘Lifestyle assets’, ‘Owner’,’Value’]:>

<:=table_it([header], ‘WC Blue Steel V2’):>

<:for item in $client.asset.filter(‘owner=Client’).sort(‘-amount’):>

<:let row1=[]:>

<:=row1.append(item.desc if item.desc else item.type_group.text):>

<:=row1.append($client.preferred_name):>

<:=row1.append(currency(item.amount.value,0, has_symbol=1)):>

<:=table_it([row1], ‘WC Blue Steel V2 Body’):>

<:end:>

<:for item in $client.asset.filter(‘owner=Partner’).sort(‘-amount’):>

<:let row1=[]:>

<:=row1.append(item.desc if item.desc else item.type_group.text):>

<:=row1.append($partner.preferred_name):>

<:=row1.append(currency(item.amount.value,0, has_symbol=1)):>

<:=table_it([row1], ‘WC Blue Steel V2 Body’):>

<:end:>

<:let totalAmount=currency(sum([float(item.amount) for item in $client.asset]),0, has_symbol=1):>

<:let footer=[‘Total’, ‘’, totalAmount]:>

<:=table_it([footer], ‘WC Blue Steel V2’):>
About elements of the above:
- To get this horizontal layout and for more complex table formats, you may need to use more than one table style, to get the 1 output. You can see here we are using the standard V2 for the header and footer but V2 Body for the body rows.
- Every loop of the assets group we are blanking out row1[] so we only, append the data from each single loop to it.
- For the body rows table_it() needs to be run within each loop. Because we are only dealing with 1 row, we’ve defined that specifically in the table_it([row1]…”) function without using a containing variable. The same thing has been done with [header] and [footer], when you use a containing variable as we did in the previous example you don’t need to sequence it with [ ]
- Please note, to keep it shorter I have only included Client and Partner so remember to account for joint or update the total coding accordingly if you use this.
- To make things easier to read in this example, you can see we’ve used ‘header’ and ‘footer’ as the variable names for what is essentially the header and footer rows. Ultimately you have to use what you feel is easier to read and makes sense for others. Consistency is important, but you don’t have to be restricted to just row1, row2 for everything.
Outputs
So those are just some simple examples, hopefully though they give you a good idea of how you can built them for yourself if suitable. Below we will get into the advantages and considerations.
Advantages of this approach
There’s some powerful benefits to using this approach to construct your documents:
Easier branding for Licensee or turnkey sites
The biggest benefit and drawcard for this approach is going to be for templates being built for Licensee and turnkey sites. On those sites you typically have multiple businesses who want their own format and branding applied to the documents. Cover pages, logos, fonts and colours can be accommodated easily enough but tables are generally problematic and not easily done without a leviathan amount of duplication or convoluted solutions that make support, updating or enhancing documents incredibly time intensive – if not more difficult.
So building your documents with this method + a mechanism to allow businesses to select or assign their preferred table style means every business on a site could readily have the documents merge out in their preferred style and brand all with the same coding so no duplication.
Even accounting for the fact that you might need a few table styles (as covered in the horizontal example) its still going to be quicker to update them in the system and have that flow down to every document that uses them, as opposed to the alternative.
Dynamic tables
The ability for the same coding to scale based on the number of objects in the data is obviously very handy. We saw how the same code could be used to generate both a client and partner or client only table.
For vertical or side by side tables which is a preference for a lot of advisers, this provides the easiest and shortest coded way to achieving those.
Universal data input
One of the key problems with other approaches of automated tables is they are limited, in either the output abilities or the data inputs. This approach covers everything. You can use this method to build simple asset, insurance, client focus tables right through to ips and risk researcher tables. The complexity of those increases sharply from the simple examples we’ve gone though today, but it offers a consistent and universal way to build out your documents.
Considerations and things to be aware of
Those advantages are going to be compelling for businesses who need to cater for multiple brandings but there are also some limitations and areas to keep in mind:
Supporting it
For a lot of xplan administrators, tech support or developers this approach might be new so you need to take into account issues around supporting it, updating and enhancing it.
The examples above seem easy enough to follow and even more so if you are familiar with Lists in xmerge. However those examples aren’t entirely accurate with how I have presented their format – especially the horizontal table. Assigning a variable or conducting list operations like <:=list.append(something):>, actually takes up a line space in your output.
So to get the horizontal table shown above, you’d need to have it in your document like this:
<:let header=[‘Lifestyle assets’, ‘Owner’,’Value’]:>
<:=table_it([header], ‘WC Blue Steel V2’):>
<:for item in $client.asset.filter(‘owner=Client’).sort(‘-amount’):>
<:let row1=[]:><:=row1.append(item.desc if item.desc else item.type_group.text):><:=row1.append($client.preferred_name):><:=row1.append(currency(item.amount.value,0, has_symbol=True)):><:=table_it([row1], ‘WC Blue Steel V2 Body’):>
<:end:>
<:for item in $client.asset.filter(‘owner=Partner’).sort(‘-amount’):>
<:let row1=[]:><:=row1.append(item.desc if item.desc else item.type_group.text):><:=row1.append($partner.preferred_name):><:=row1.append(currency(item.amount.value,0, has_symbol=True)):><:=table_it([row1], ‘WC Blue Steel V2 Body’):>
<:end:>
<:let totalAmount=currency(sum([float(item.amount) for item in $client.asset]),0, has_symbol=True):><:let footer=[‘Total’, ‘’, totalAmount]:><:=table_it([footer], ‘WC Blue Steel V2’):>
As you can see, we’d need to put everything in the loop and footer on the one line, making it a lot less readable and easier to work with – keeping in mind this is a basic example. All those line items for the Client/Partner example would also need to be on one line or the table wouldn’t merge till half way down your page with all empty lines above it.
In contrast, the usual approach to table construction for the same data:
.
The above example is simpler and relationally logical to the support person, as to what data is being used and what the expected outcome is.
There are other techniques you can employ to maintain the ease of the main documents code – without putting everything on one line – unfortunately, these either make the coding more complex or obfuscate it in the document, slowing down the support process anyway (things like making it font size 1, putting the code into fixed tables or hidden objects).
For licensee or hosted sites, up-skilling the team supporting this, so you can utilise this approach may be well worth it. Just consider if you can deliver all the data within the limits of this system, for advice tool tables these are going to be complex and may be more difficult to maintain.
On the other hand if you are building templates for a small business, where the paraplanner or admin staff will likely be the ones updating the document in the future, it might be worth keeping it simple for them; its more likely the business will need to update content in the documents long before they will their brand colours.
Images, iconography and contemporary design
This function doesn’t support merging through imagery or iconography.
A couple of factors are pushing new design paradigms in our industry, particularly for advice businesses when considering updating or implementing new documents and tools. At the most basic level, increasingly we are sending more information electronically – even advice documents. The old idea of plain grey business and advice documents, just looks and feels outdated to clients when viewed on this medium.
As advice businesses leverage new technology more and more, to engage with clients both on providing services, information and presenting advice, you again find the need for high fidelity, visually engaging materials otherwise it just looks out of place. With digital advice models on the ascendancy and the possibility that in several years we might not only be proving most everything electronically, but also via interactive media, this trend to more contemporary and visual design isn’t going away and will only increase in popularity for clients.
You’ll need to keep that in mind if you go down that path, as once you have a couple of tables that you can’t use table_it() for, the benefits can start to acutely diminish (depending on design), especially if you are using it for a hosted or licensee site.
Be aware of the table format limits
You will need to spend some time playing with the table format before you start your project to ensure you know what the limitations are.
For example:
- Certain colours when used for borders or small shading areas merge out with the wrong colour;
- If you specify a row height it will merge out as ‘exactly’ that height, not ‘at least’ that height. This may mean you need more table formats than you expected (depending on design).
- Allocation of the columns: you will note in both these examples the table_it() function divides the columns evenly. That won’t always be what is required. You can use colspan to help with that but, again it makes the coding more complex and more time consuming to build.
- Text Alignment, text colour and style: Table format has limits on how far you can achieve these. Again, using multiple table formats you may be able to get around a bit of this.
- Split rows: No good system in place to accommodate split rows as you commonly see with insurance and IPS data.
Vertical table limits
The problem with vertical tables is you can only fit so many on a page. Usually once you get to about 4-5 columns the data is starting to become compressed and less easily readable. This function has no mechanism to handle that, so keep that in mind if you build out a vertical option and there is the possibility of a client having more than ‘x’ items. Sophisticated users will likely expect an answer or your solution to account for these outliers.
Concluding thoughts
To an extent this function represents the microcosm of what xplan development can be like. It has potentially great benefits but to maximise those rewards you really need to consider the bigger picture and be aware of the limitations or the areas that could cause problems. This will allow you to work through suitable solutions and properly assess if this is going to be the right approach or if the objectives and complexities might be prohibitive.
Depending on what is trying to be achieved, who its for and the design, this could be a fantastic solution to giving businesses on hosted sites more freedom and choice. On the other hand if the benefits aren’t there, you might be creating an unnecessarily complex solution whose benefits don’t surpass the complexity; making it more difficult to support, update and enhance going forward.
So like always, be aware of this as an option, keep the limits in mind and balance your approach accordingly.